

Vbox was strapped to the car earlier this morning for a 0-100mph test on my usual stretch of private runway.
Car and conditions
Brand new car with only 175m covered so far. Temperature was a lowly 1.5c.

I tried my best to warm up the tyres but even after 12 miles of warm ups they had only risen 10-15c above ambient temps. Front right will always have the warmest tyre as it has my 85kg carcass over it.
Fair to say, not ideal conditions for a 0-xxx mph launch. Ideally the ambient temp needs to be between 12-18c, and all tyres at 25-30c+, the warmer the better. Pressures are not great either, at the dragstrip I'd be looking to keep them between 28-32psi so they are way higher.
Vbox display screen (1ft rollout OFF)...

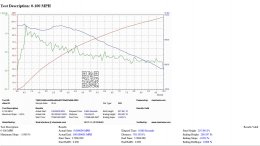
Exact breakdown in Performance Tools...

This chart shows the exact breakdown to the 1/00th as 3.76 to 60mph and 8.76 to 100mph.
It is extremely difficult if not impossible to find a stretch of road/runway that offers a 0% gradient so it is very important to also plot height in any vbox display charts. In the run above, I am at a starting height of 63.3m and a finishing height of 61.2m so over the 240 metres covered to reach 100mph, it drops 2m in height. (2.1m/240m x 100 = 0.87% gradient) - This is well within acceptable limits. Some forum leaderboards use a 3% limit (GTR forums) Racelogic themselves use a 2% limit and some even push for a 1% limit, my run above falls within all acceptable ranges.
You can see from the attached chart that the vbox display graph starts at 0mph. This is the indication you need to determine whether 1ft rollout is switched on or off in the menus. If 1ft rollout was selected on, the graph would start at 4-5mph, not 0mph. A lot of people 'cheat' with this feature so it's something to watch out for when people post vbox charts online.
Performance tools as plotted above is the primary Racelogic verification tool to use for acceleration figures. However, there is a 3rd party application called vbox verify (Not racelogic endorsed) that takes the vbox file and applies an algorithm to determine what the run would be if the gradient was 0%. It's a useful tool and compensates and standardises each run for comparison purposes.
When uploading the file to the vbox verify website, the figures come in a little slower at....
0-60mph = 3.85secs
0-100mph = 8.86secs


Just for information, look at the difference the 1 foot rollout is making to the runs. There's 4/10 of a second difference improvement with it switched on. This is quite high as the usual difference with it being on would normally show a 0.2-0.3secs improvement but at 0.4s as above, this shows that I had quite a bit of wheelspin off the line (1 foot rollout = First foot not measured )
Forget the 1/4 time displayed above, I was off the throttle by the time 402m had elapsed (91mph)
Overall, a little bit of a disappointment with the 0-60 figure, I was expecting a solid 3.5 or 3.6 but considering the conditions and the limited mileage, I can't be too harsh. There was a little slip and there was a little torque steer and I'm in no doubts with more favourable launching conditions and more running in, the car will do a 3.5 or a 3.6 no problems.
I was pleased to see 0-100mph in under 9secs though and 8.8secs with a poor launch and 175m on the clock is a great starting point.
Will give it another go in a couple of weeks when the car has some more miles in it and hopefully in slightly warmer conditions too.
Tuning wise, probably not until after Christmas now, there really isn't much out there for these new engines yet.
Car and conditions
Brand new car with only 175m covered so far. Temperature was a lowly 1.5c.
I tried my best to warm up the tyres but even after 12 miles of warm ups they had only risen 10-15c above ambient temps. Front right will always have the warmest tyre as it has my 85kg carcass over it.
Fair to say, not ideal conditions for a 0-xxx mph launch. Ideally the ambient temp needs to be between 12-18c, and all tyres at 25-30c+, the warmer the better. Pressures are not great either, at the dragstrip I'd be looking to keep them between 28-32psi so they are way higher.
Vbox display screen (1ft rollout OFF)...
Exact breakdown in Performance Tools...
This chart shows the exact breakdown to the 1/00th as 3.76 to 60mph and 8.76 to 100mph.
It is extremely difficult if not impossible to find a stretch of road/runway that offers a 0% gradient so it is very important to also plot height in any vbox display charts. In the run above, I am at a starting height of 63.3m and a finishing height of 61.2m so over the 240 metres covered to reach 100mph, it drops 2m in height. (2.1m/240m x 100 = 0.87% gradient) - This is well within acceptable limits. Some forum leaderboards use a 3% limit (GTR forums) Racelogic themselves use a 2% limit and some even push for a 1% limit, my run above falls within all acceptable ranges.
You can see from the attached chart that the vbox display graph starts at 0mph. This is the indication you need to determine whether 1ft rollout is switched on or off in the menus. If 1ft rollout was selected on, the graph would start at 4-5mph, not 0mph. A lot of people 'cheat' with this feature so it's something to watch out for when people post vbox charts online.
Performance tools as plotted above is the primary Racelogic verification tool to use for acceleration figures. However, there is a 3rd party application called vbox verify (Not racelogic endorsed) that takes the vbox file and applies an algorithm to determine what the run would be if the gradient was 0%. It's a useful tool and compensates and standardises each run for comparison purposes.
When uploading the file to the vbox verify website, the figures come in a little slower at....
0-60mph = 3.85secs
0-100mph = 8.86secs
Just for information, look at the difference the 1 foot rollout is making to the runs. There's 4/10 of a second difference improvement with it switched on. This is quite high as the usual difference with it being on would normally show a 0.2-0.3secs improvement but at 0.4s as above, this shows that I had quite a bit of wheelspin off the line (1 foot rollout = First foot not measured )
Forget the 1/4 time displayed above, I was off the throttle by the time 402m had elapsed (91mph)
Overall, a little bit of a disappointment with the 0-60 figure, I was expecting a solid 3.5 or 3.6 but considering the conditions and the limited mileage, I can't be too harsh. There was a little slip and there was a little torque steer and I'm in no doubts with more favourable launching conditions and more running in, the car will do a 3.5 or a 3.6 no problems.
I was pleased to see 0-100mph in under 9secs though and 8.8secs with a poor launch and 175m on the clock is a great starting point.
Will give it another go in a couple of weeks when the car has some more miles in it and hopefully in slightly warmer conditions too.
Tuning wise, probably not until after Christmas now, there really isn't much out there for these new engines yet.
Attachments
Last edited: